ProMoS NG – Visualisation
The user interface adapts automatically to the screen size. Smartphones and tablets therefore offer the same functions as the PC – not only the process diagrams but also the DMS (data management system) and the trend displays.
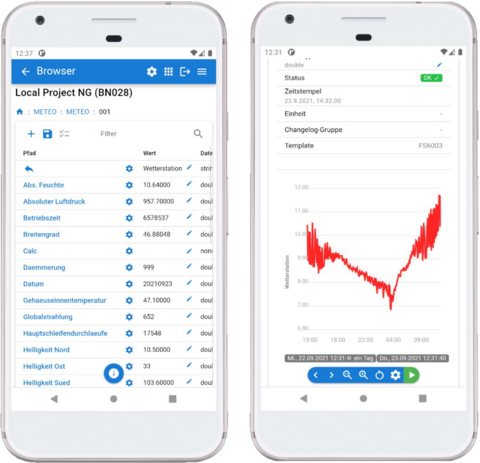
This lets you monitor processes, analyse trends and manage data on the move.
The proven ProMoS NT philosophy has been retained:
- Template objects: operating screens are now generated per device for PC, tablet and smartphone.
- Central changes: when a template object is adjusted, it changes automatically on all process diagrams.
- Initialising attributes: as in ProMoS NT, but with many more options.
- Edit and runtime mode: current data is displayed continuously even in edit mode.

New in ProMoS NG:
- Undo/redo: easily undo and restore changes.
- Auto-scaling: the diagram adapts automatically to the size of the output device.
- Multi-user: several people work on the same project at the same time, each on different diagrams.
Design is completely free: background photos and videos can be embedded in the process diagrams.
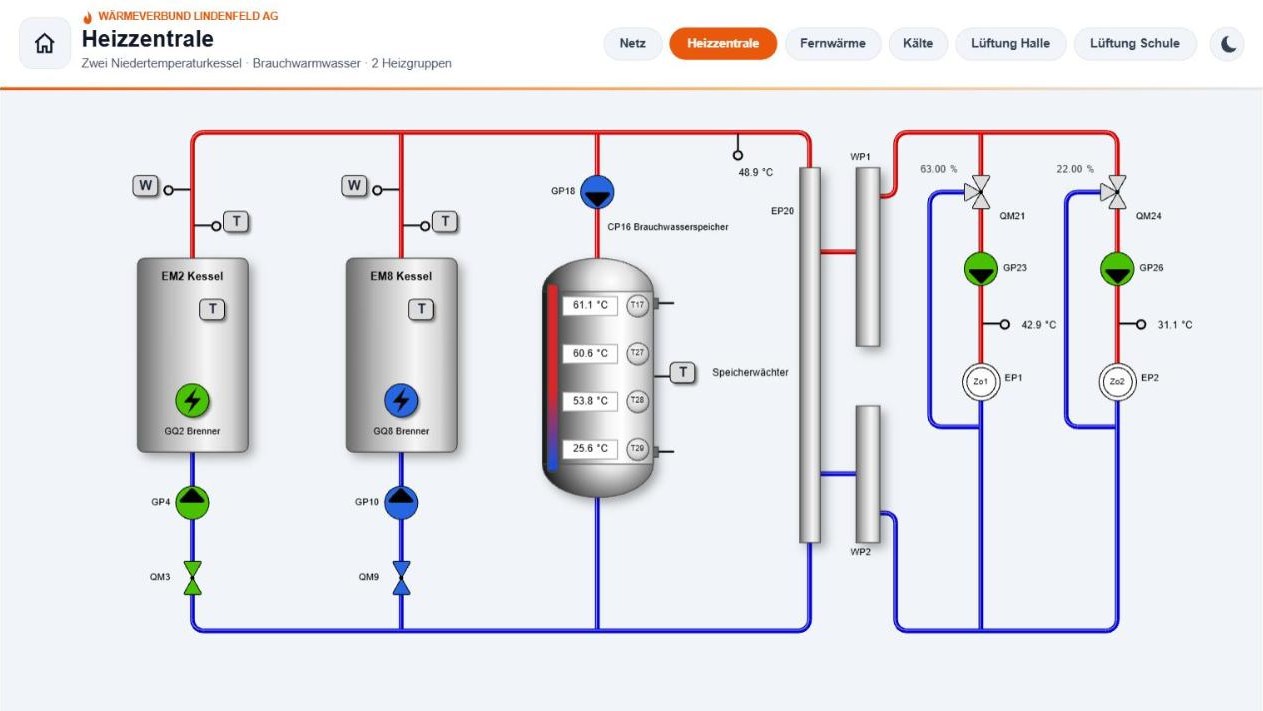
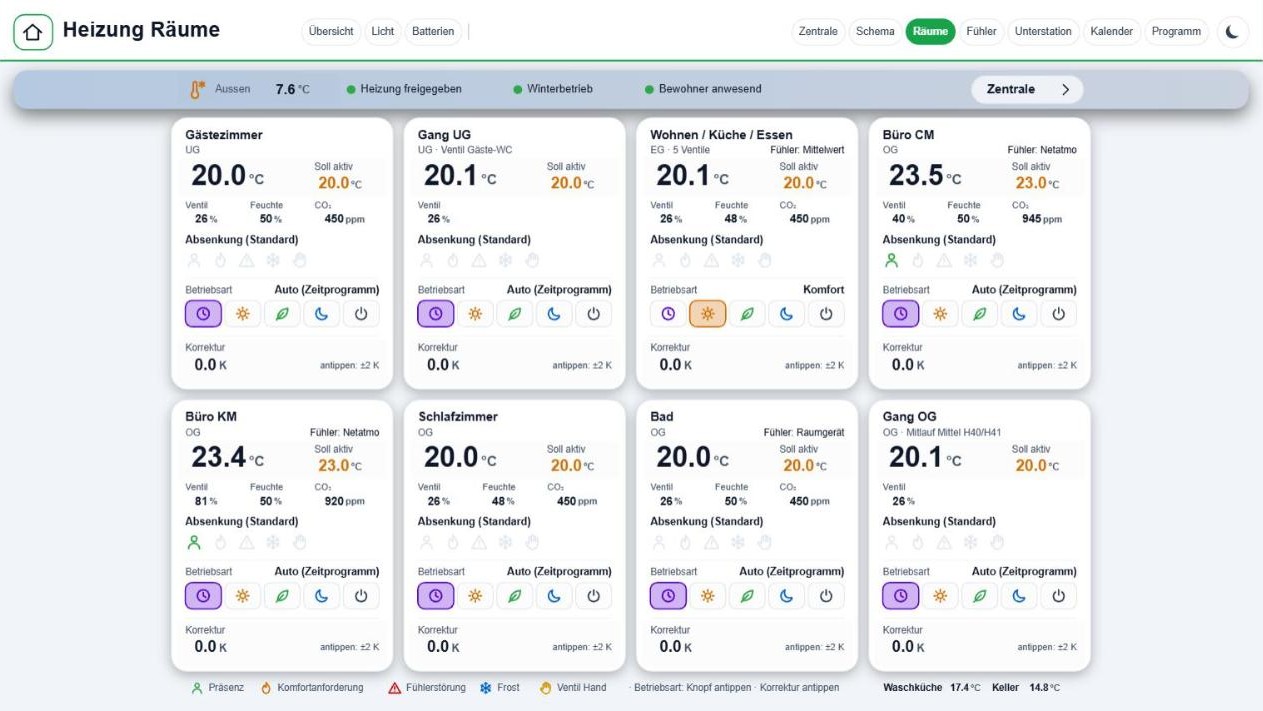
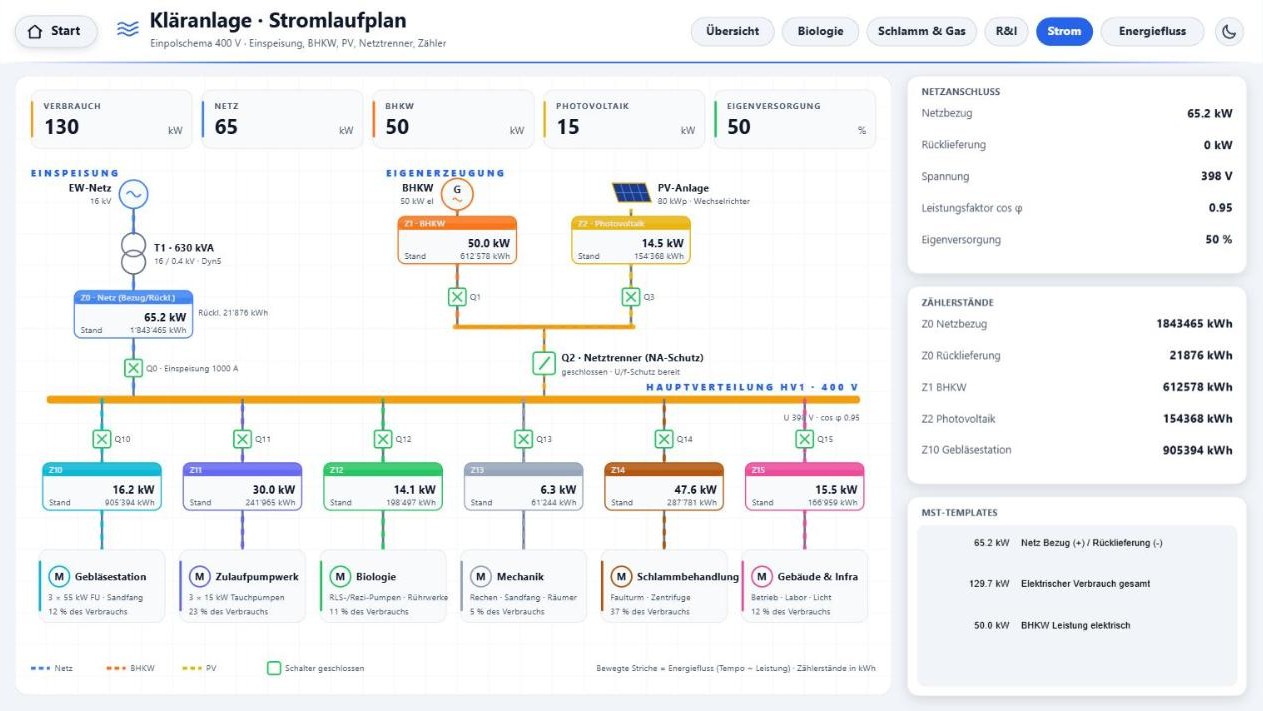
The following examples come from the ProMoS NG demo project – all values are simulated. Every page is available in a light and a dark design.
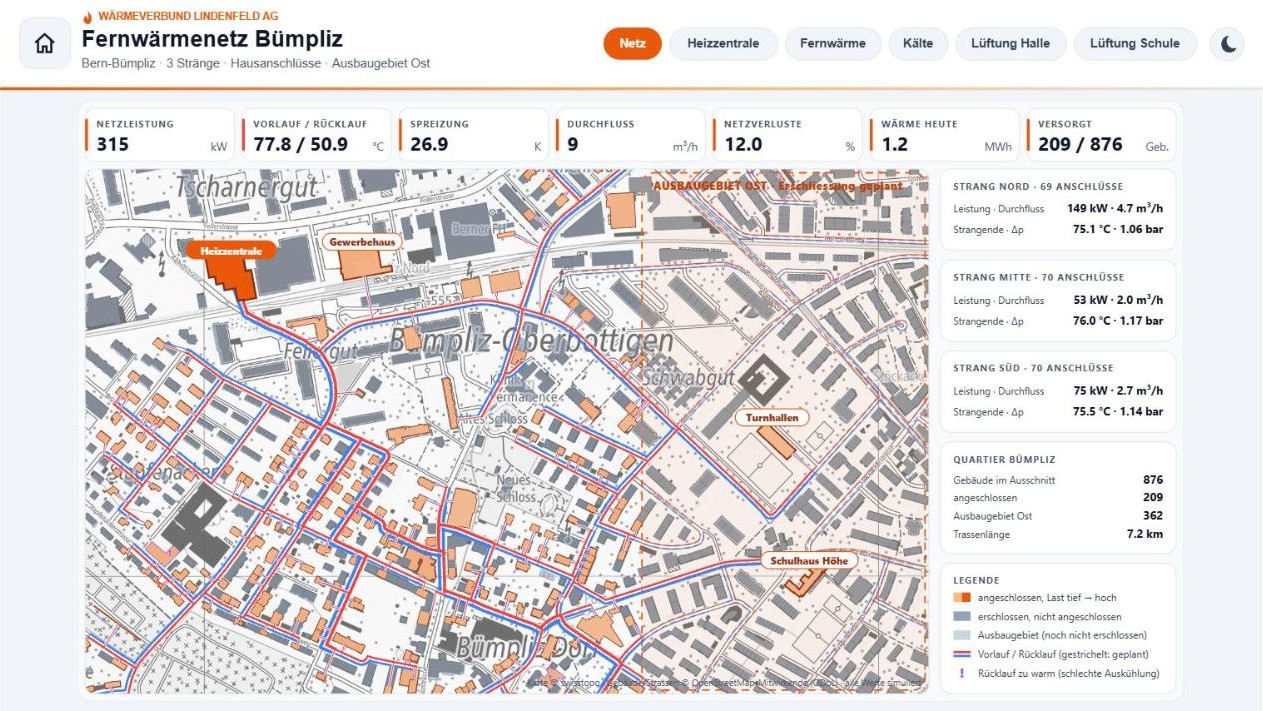
District heating network on the city map with heating plant, three branches, house connections and the planned expansion area – with network output, temperature spread and network losses.
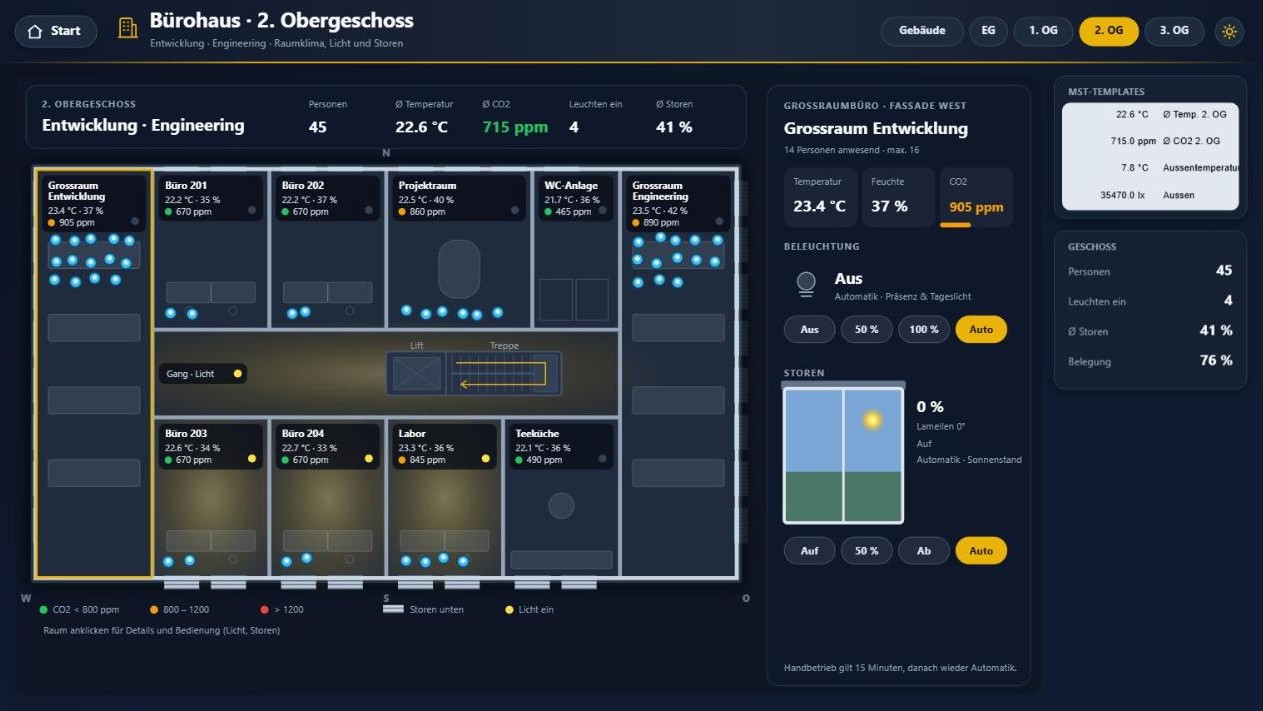
Floor plan of an office storey with temperature, humidity and CO₂ per room, plus direct control of lighting and blinds – shown here in the dark design.
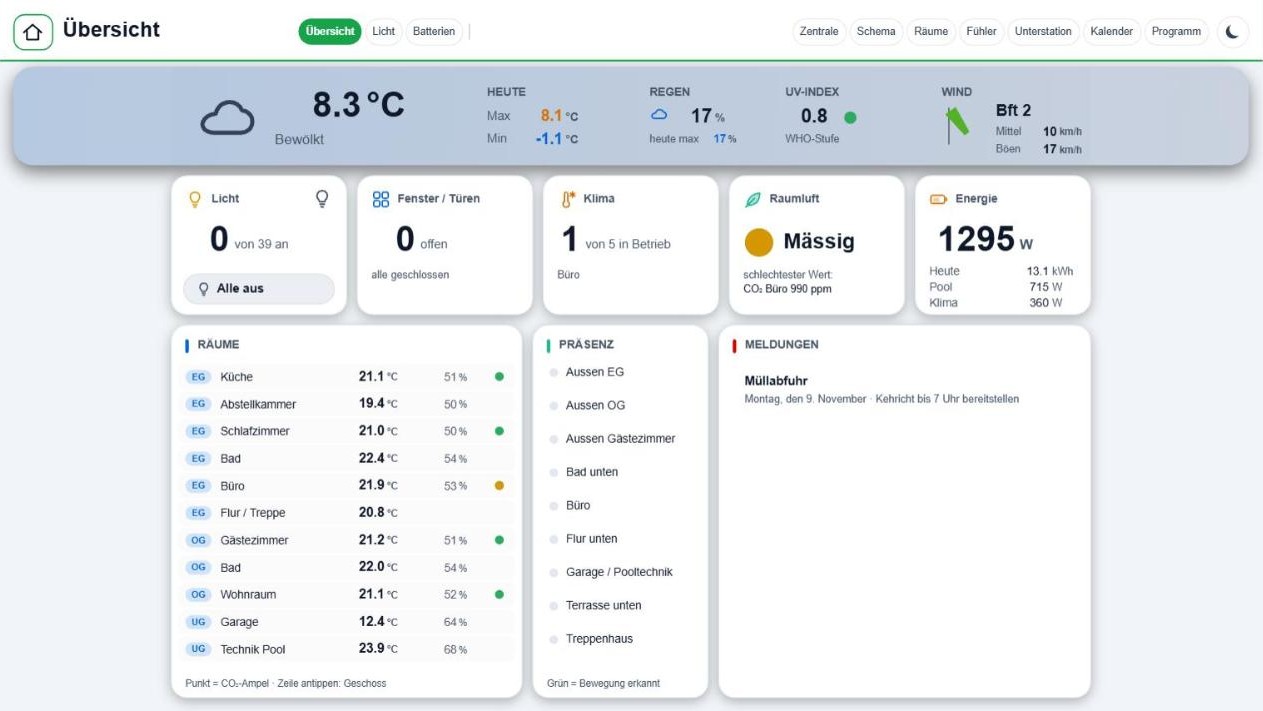
Overview of a residential building with room temperatures, lighting, shading and weather data at a glance – shown here in the light design.
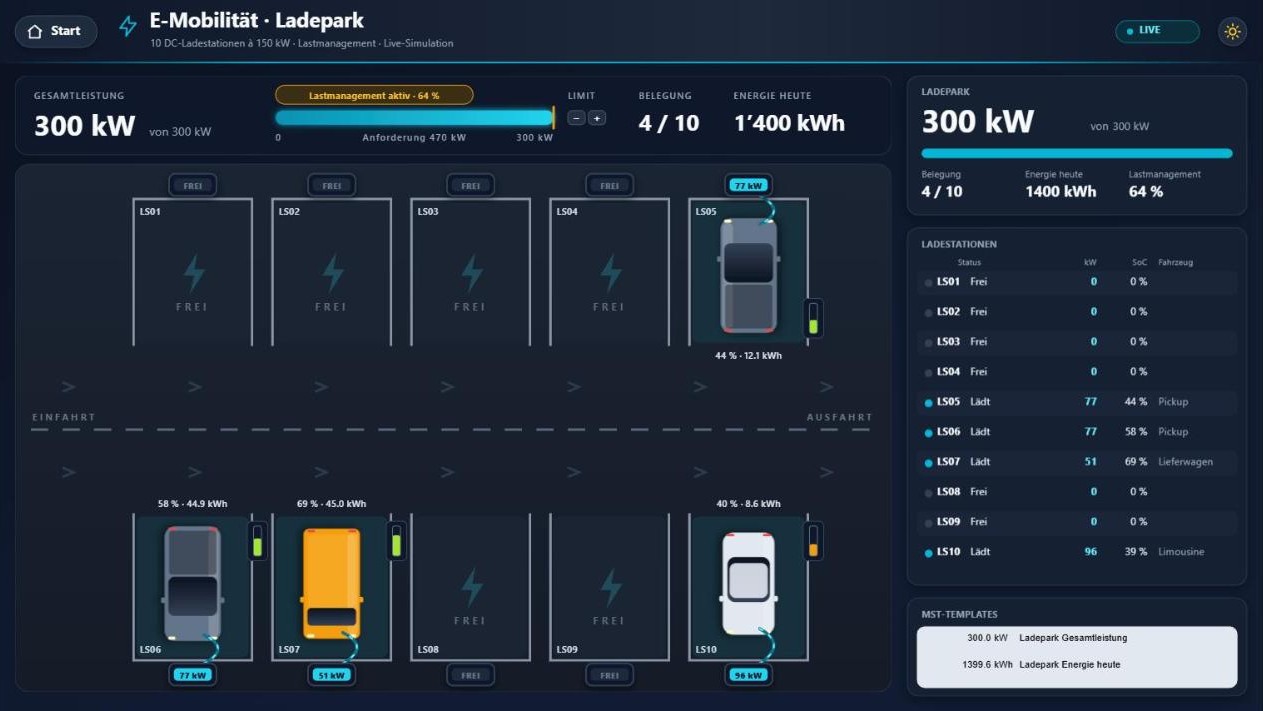
Ten charging stations with live occupancy, charging power and dynamic load management – shown here in the dark design.
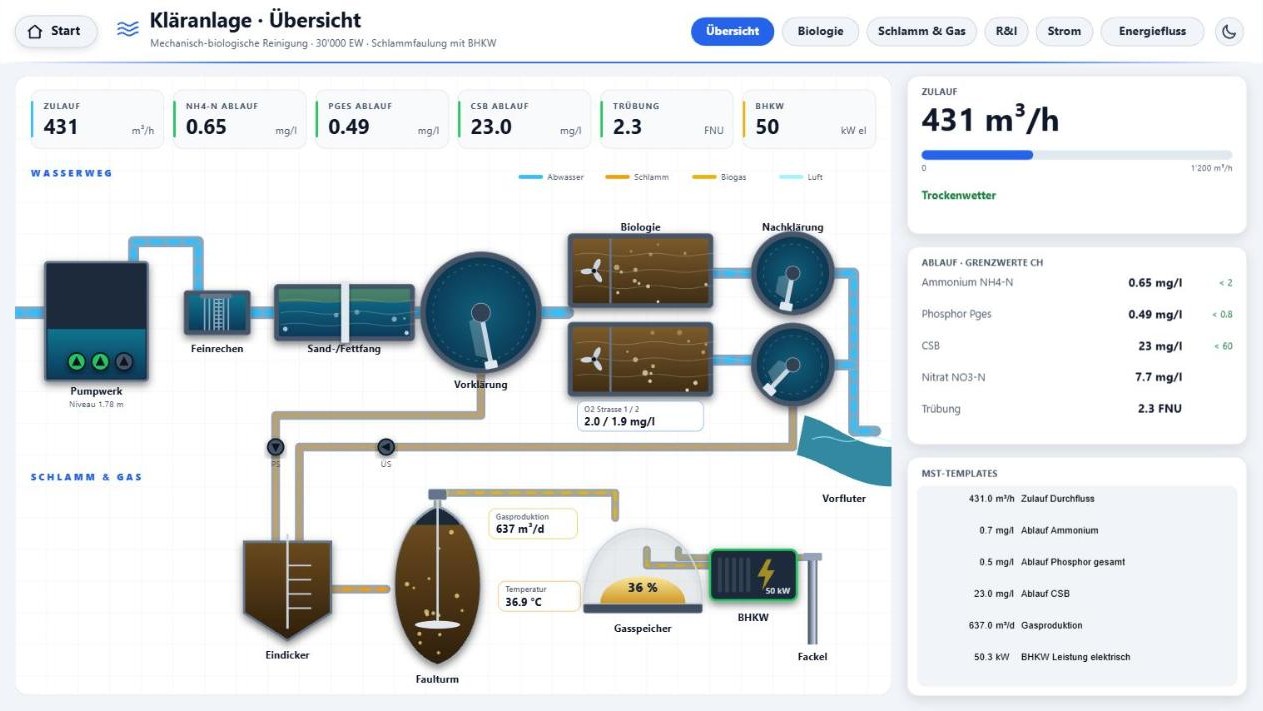
Mechanical-biological treatment as a process diagram with inflow, biology, sludge treatment and effluent values compared with the limits.
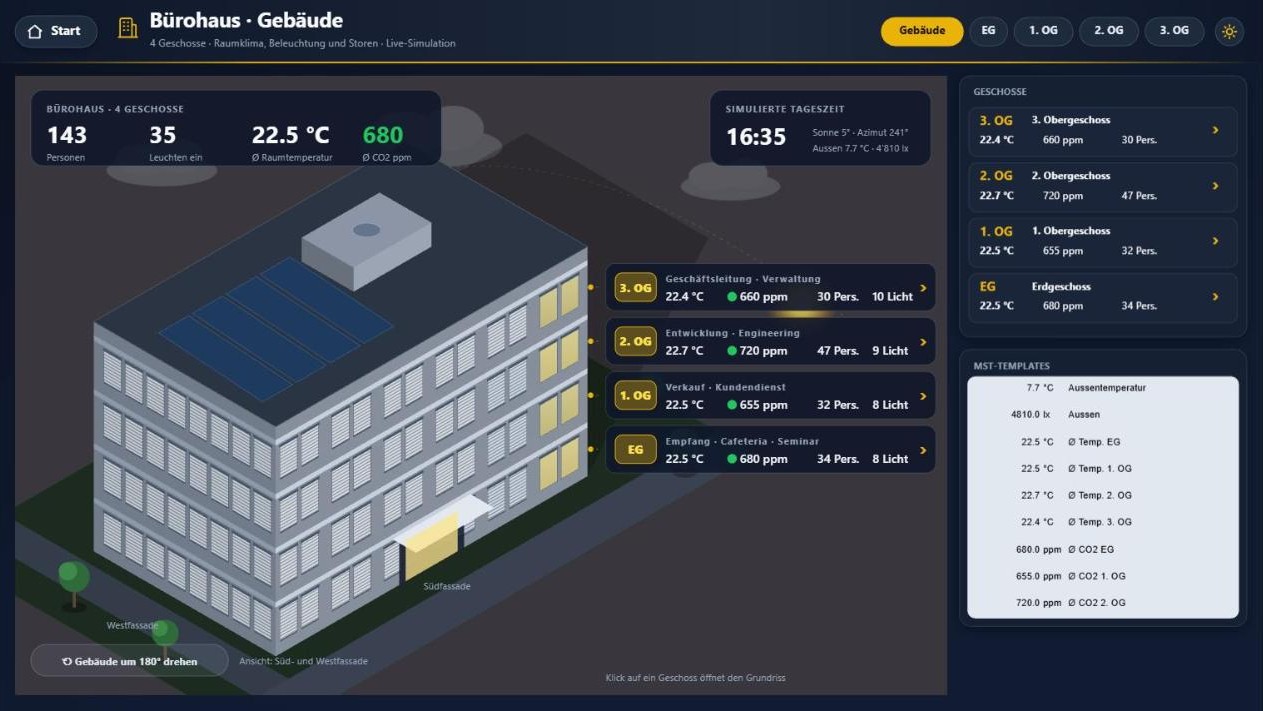
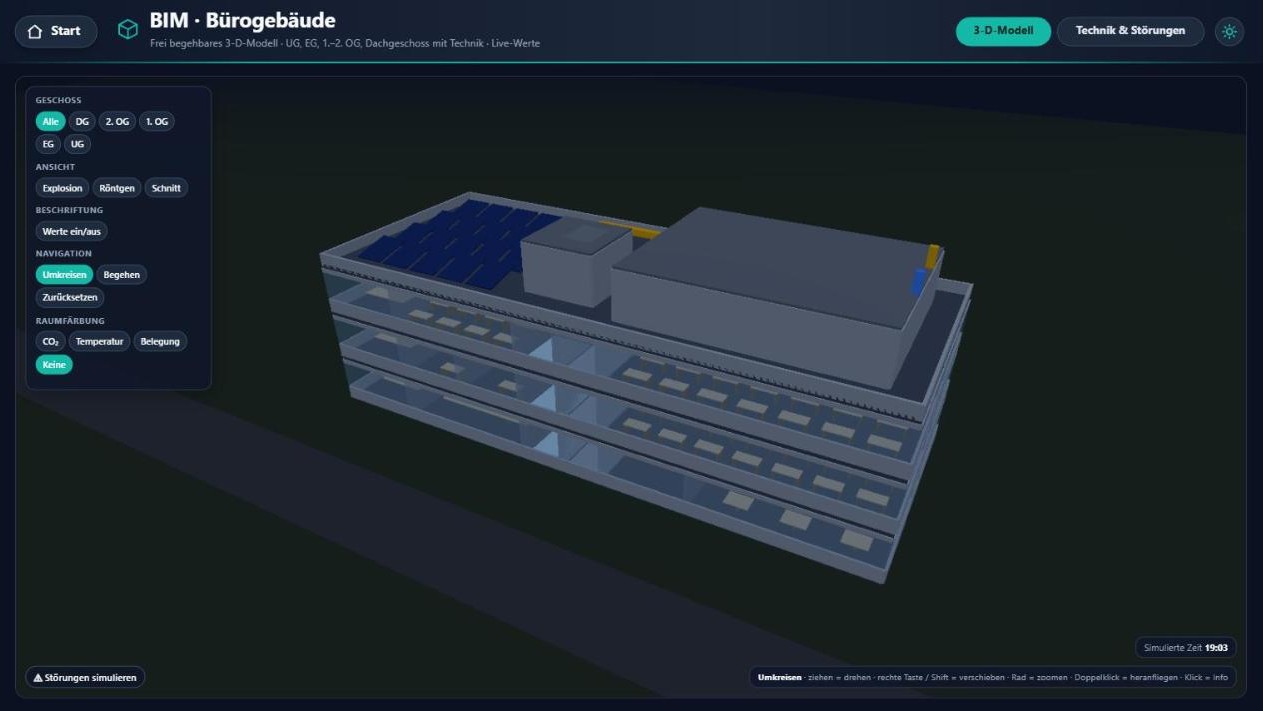
The office building as a 3D model: rotate, zoom and navigate through the floors – with live values right on the component.
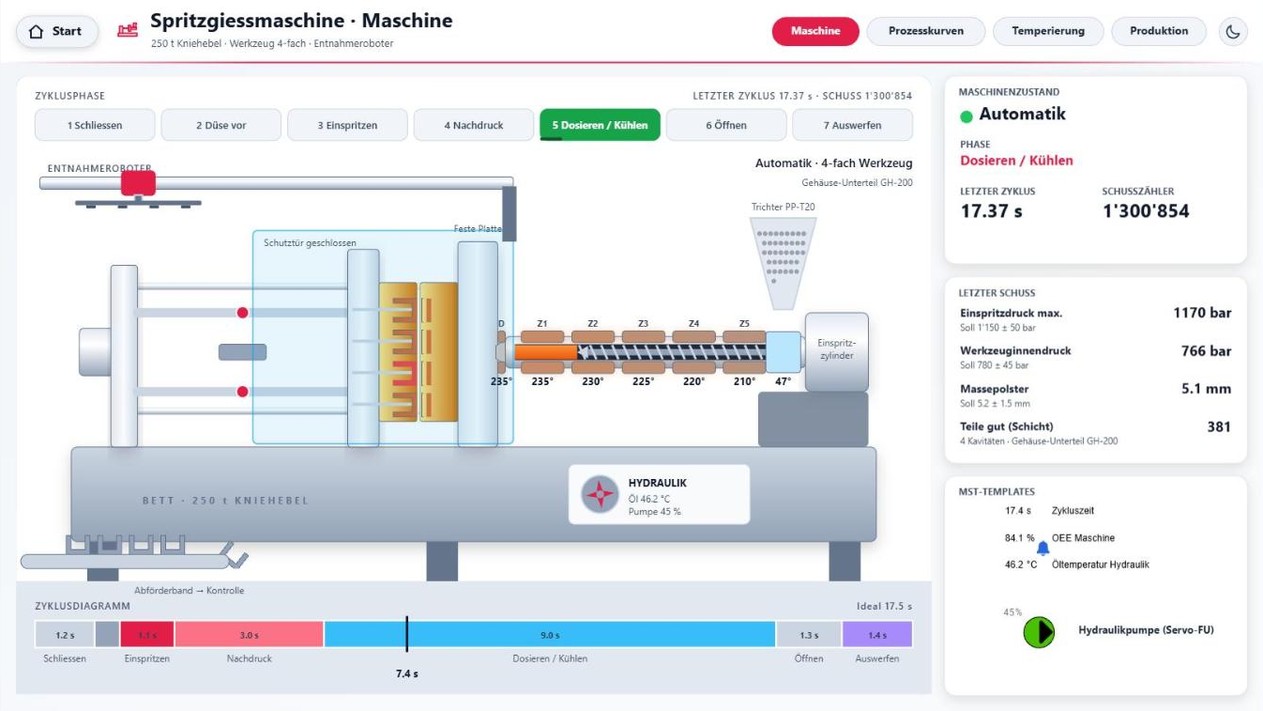
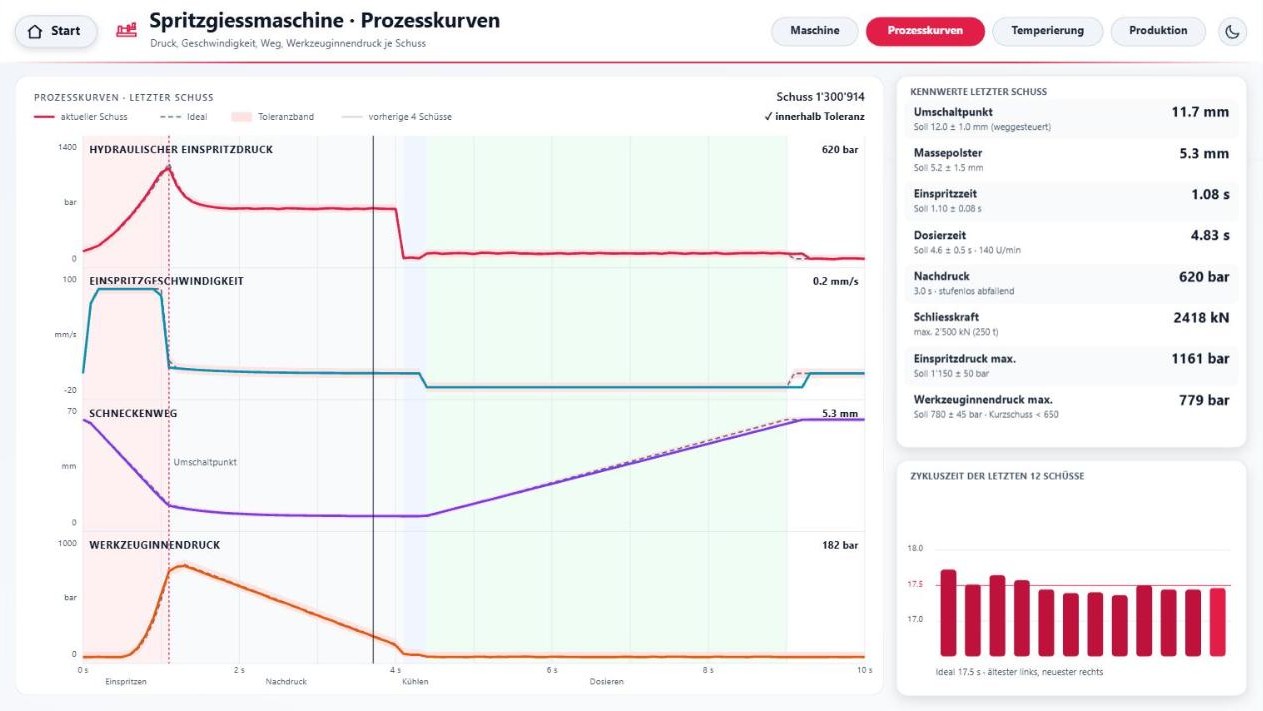
Toggle-lever machine with animated cycle phase, temperature zones, shot data and cycle diagram – combined with MST templates.
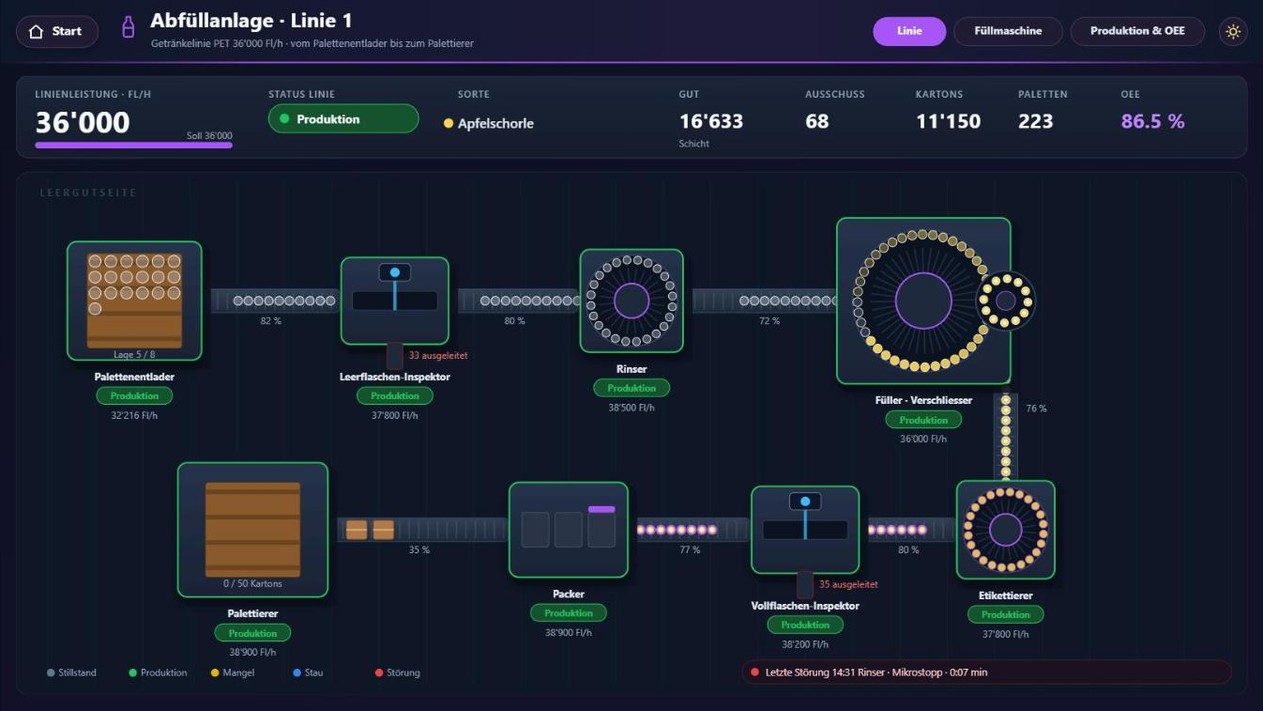
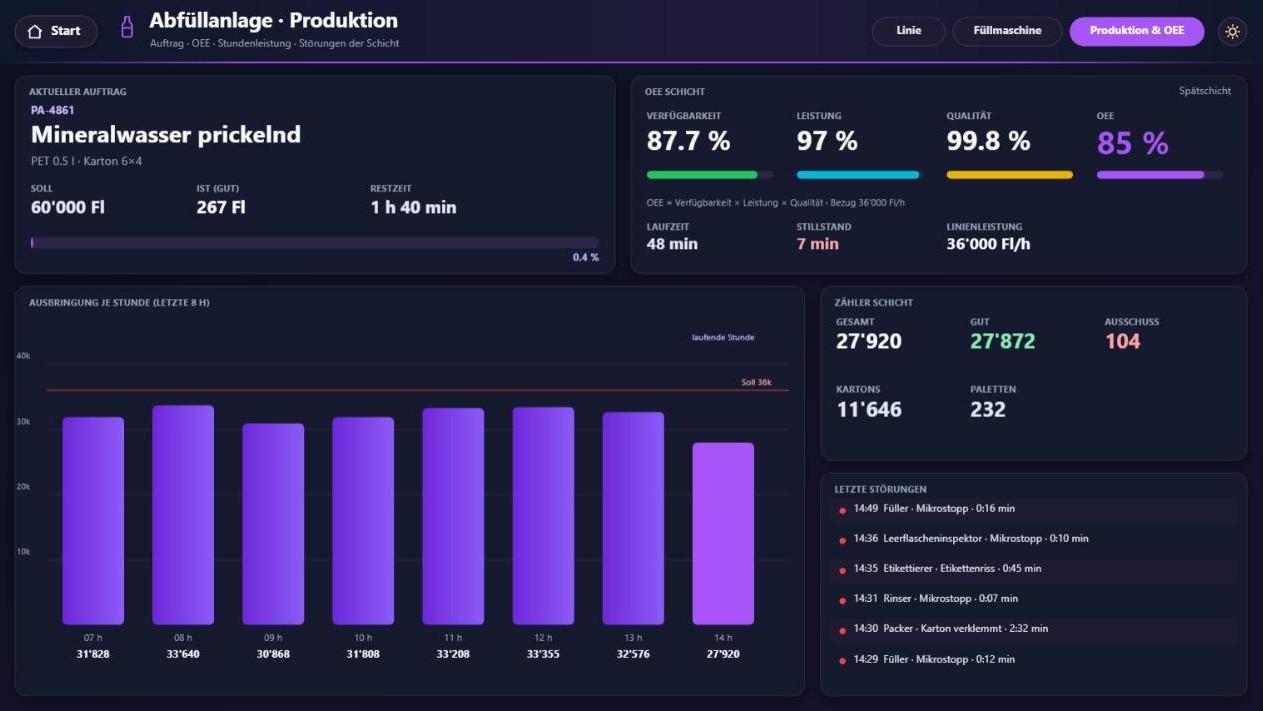
PET line with 36,000 bottles per hour from depalletiser to palletiser – with the status of every machine, the buffers and the OEE.
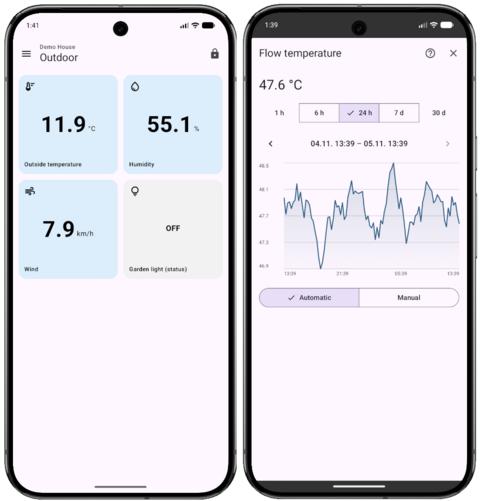
ProMoS Dashboard is a native app for iOS and Android. It puts the key values of your plant on your smartphone or tablet at any time – without a dedicated process diagram.
- Data points: display individual DMS data points and change them directly when needed, for example a setpoint.
- Trends: view trend data and assess the history of a value at a glance.
- Switches: enable processes or switch lighting on and off.
- Complex tiles: composite controls, for example for blind control.
Note: the iOS and Android apps are currently in the test phase.